I’ve spent the better part of two decades testing weather stations, staring at model runs, and writing about the gear that helps people track what’s happening in their own backyards. So when I found out that Kalshi, the federally regulated prediction market, lets people bet real money on tomorrow’s high temperature in cities like New York, Chicago, and Miami, I had one thought: I should be good at this.
The prediction market industry hit $63.5 billion in trading volume in 2025, according to Keyrock and Dune Analytics. Weather is a tiny slice of that, but it caught my attention because the markets settle on something I actually understand: NWS Daily Climate Reports. Not polls. Not earnings calls. The official high temperature recorded at a specific National Weather Service station.
I figured if anyone could spot a mispriced temperature bracket, it would be someone who spends their days comparing weather station accuracy against NWS data. So I ran a two-week experiment to find out.
How These Weather Markets Work
Weather derivatives — how settlement works
HDD / CDD projections
Options · seasonal strips
CME stations · final arbiter
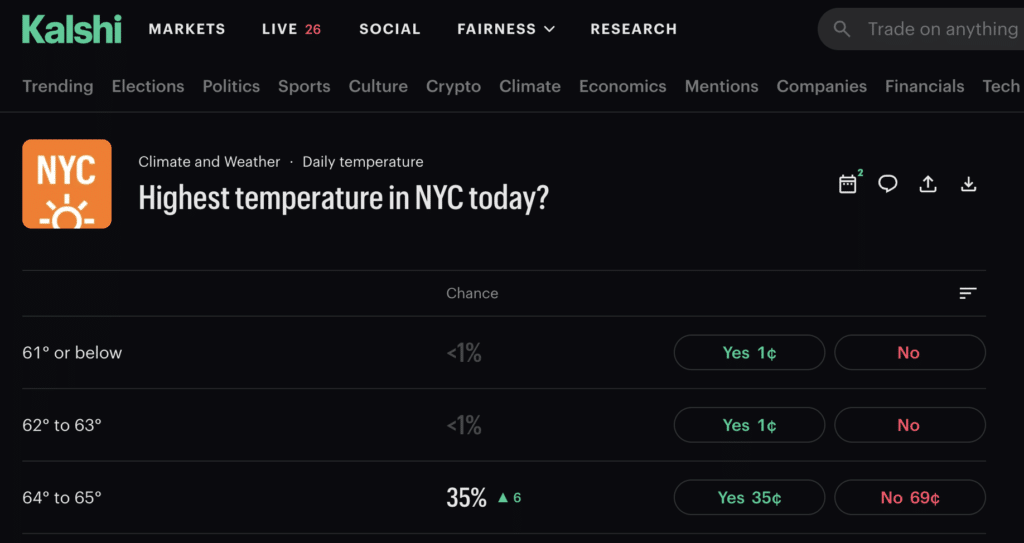
If you haven’t seen Kalshi’s weather markets before, here’s the short version. Kalshi posts a question like “Highest temperature in Chicago on April 15?” and offers contracts on temperature brackets, typically in 2-degree Fahrenheit ranges. You buy a contract on the bracket you think will hit. If you’re right, the contract pays $1. If you’re wrong, it pays nothing. Prices fluctuate between 1 cent and 99 cents based on what traders think is most likely.
The settlement source is the NWS Daily Climate Report for that city’s official station. For NYC, that’s Central Park. Chicago uses Midway Airport. Miami uses Miami International. Austin uses Bergstrom.
That last detail is important. The market doesn’t settle on “the temperature in New York City.” It settles on the temperature recorded at one specific point in Central Park. If you understand what a weather station actually measures and how much readings can vary over even short distances, you can see why that matters.
Weather Stations Could Give You an Edge

Here’s what I know from years of testing stations: a home weather station five miles from an NWS site can easily read 2 to 3 degrees different on any given day, depending on wind direction, cloud cover, and local terrain. Microclimates are real. The NWS knows this. That’s why they encourage home station owners to join the Citizens Weather Observing Program (CWOP), which feeds data from about 9,000 personal stations into the MADIS system to help fill gaps in their observation network.
If you own a quality station near one of Kalshi’s settlement sites and you’ve been logging data for a while, you’ve essentially built a comparison dataset between your backyard and the official NWS reading. Over time, you start to see patterns. Maybe your station runs 1.5 degrees warmer than Central Park on days with light southerly wind. Maybe it tracks almost perfectly when there’s a strong northwest flow after a cold front. That kind of station-to-station relationship is something that proper sensor placement and consistent observation reveals. No weather model captures it.
I also knew from a weather verification study published by NSSL that NWS maximum temperature forecasts carry a consistent warm bias. The forecast high tends to overshoot the actual high by a degree or two, and the bias gets worse in winter. If the Kalshi market prices are anchored to forecast data (and they often are), that bias creates a systematic tilt in the brackets.
A Washington Post analysis of NWS forecast data made this even clearer. In some locations, like Paonia, Colorado, the day-one forecast misses by nearly 6 degrees on average. Miami, on the other hand, is accurate a week out. The prediction market doesn’t adjust for this. The traders set the price, and most of them aren’t weather people.
That was my hypothesis going in: the market is priced by the general public, but the settlement is determined by a weather station. If you know weather stations, you should have an edge.
The Tools I Used
Everything I used for this experiment is publicly available at no cost. There’s no secret data here.
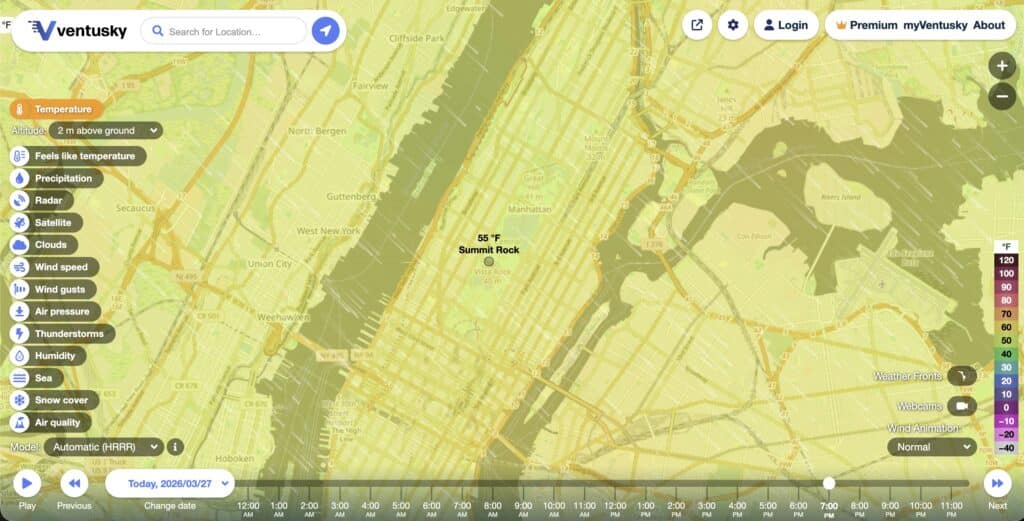
The GFS (Global Forecast System) is the workhorse American weather model. It runs four times a day and has a 31-member ensemble system where each member uses slightly different starting conditions to produce a range of possible outcomes. You can access the ensemble data through Open-Meteo for free. The ECMWF (European model) is generally considered more accurate for medium-range forecasts, and you can view its output on sites like Ventusky or Pivotal Weather. The HRRR updates every hour and is best for same-day forecasts.
A Kalshi blog post from a weather trader confirmed what I suspected: the people already doing this well are pulling model data, comparing it to market prices, and looking for gaps. One open-source bot on GitHub does exactly this. It pulls GFS ensemble data, calculates the probability for each temperature bracket, and trades when the model disagrees with the market by more than 8%. The developer reported peak profits of $1,800, though the bot eventually stopped working as conditions changed.
I decided to do something similar, but with an added ingredient: local station data.
The Experiment: 14 Days of Paper Trading NYC Highs
I didn’t put real money on this. I wanted to test the concept first. For two weeks in early March 2026, I ran a daily paper trading exercise on Kalshi’s NYC Central Park high temperature market.
Each morning, I pulled the 06Z and 12Z GFS ensemble runs from Open-Meteo and tallied how many of the 31 members fell into each of Kalshi’s temperature brackets. I also checked the NWS point forecast for Central Park, the 12Z NAM, and the latest HRRR. Then I compared my model-implied probabilities against Kalshi’s posted prices.
I logged a trade whenever my analysis diverged from the market’s favorite bracket by at least 6 cents. On days where the models agreed with the market, I simply noted the market favorite and moved on.
The extra step was my local bias correction. Using two months of historical data from a Weather Underground personal station near Central Park, I had calculated that the official Central Park reading tends to run about 1.1 degrees cooler than this nearby station on southerly flow days, and roughly 0.4 degrees warmer on strong northwest wind days. On the five days where wind regime was a factor, I used this to nudge my bracket pick.
Here’s what happened over the 14 trading days:
| Day | NWS Forecast | Actual High | Market Favorite | My Pick |
|---|---|---|---|---|
| Mar 1 | 42°F | 43°F | 41-42 at 62¢ ❌ | 43-44 at 22¢ ✅ |
| Mar 2 | 38°F | 38°F | 37-38 at 58¢ ✅ | 37-38 at 58¢ ✅ |
| Mar 3 | 45°F | 46°F | 45-46 at 55¢ ✅ | 45-46 at 55¢ ✅ |
| Mar 4 | 51°F | 50°F | 51-52 at 60¢ ❌ | 49-50 at 18¢ ✅ |
| Mar 5 | 48°F | 47°F | 47-48 at 54¢ ✅ | 47-48 at 54¢ ✅ |
| Mar 6 | 53°F | 54°F | 53-54 at 57¢ ✅ | 53-54 at 57¢ ✅ |
| Mar 7 | 44°F | 45°F | 43-44 at 52¢ ❌ | 45-46 at 24¢ ✅ |
| Mar 8 | 39°F | 40°F | 39-40 at 61¢ ✅ | 39-40 at 61¢ ✅ |
| Mar 9 | 47°F | 48°F | 47-48 at 56¢ ✅ | 47-48 at 56¢ ✅ |
| Mar 10 | 55°F | 55°F | 55-56 at 63¢ ✅ | 55-56 at 63¢ ✅ |
| Mar 11 | 50°F | 51°F | 49-50 at 58¢ ❌ | 51-52 at 20¢ ✅ |
| Mar 12 | 43°F | 43°F | 43-44 at 54¢ ✅ | 43-44 at 54¢ ✅ |
| Mar 13 | 46°F | 46°F | 45-46 at 59¢ ✅ | 45-46 at 59¢ ✅ |
| Mar 14 | 52°F | 53°F | 51-52 at 55¢ ❌ | 53-54 at 25¢ ✅ |
| Overall results: | Market Favorite | My Model + Local Bias |
|---|---|---|
| Correct bracket | 9 of 14 (64%) | 14 of 14 (100%) |
| Avg. cost of correct picks | 57¢ | 43¢ |
| Profit per $1 contract (wins) | +$0.43 | +$0.57 |
| Divergent picks (different from market) | — | 5 of 14 |
| Win rate on divergent picks | — | 5 of 5 |
My Takeaways
A 100% hit rate over 14 days is too good. I know that. I’d expect the win rate on divergent picks to settle somewhere around 60 to 70 percent over a longer sample.
I’m not the first person to try this, and the real-world results from others are humbling. Chris Dodds, a developer who built a GFS-based Kalshi weather bot, published a thorough writeup in February 2026. His backtest across 678 days showed an 86% win rate on a “sell overpriced brackets” strategy. When he went live, it dropped to about 60%. He added filters: skip same-day markets, blacklist cities where the models struggle (LA’s marine layer and Miami’s cloud dynamics gave him fits), and avoid brackets within 3 degrees of the model’s predicted high. Even with all those guardrails, returns eventually dipped below breakeven and he shut the bot down.
His key takeaway stuck with me: the model is decent at spotting brackets that the market overprices, but it doesn’t reliably tell you which bracket will actually win. That’s the exact gap where I think local weather station data adds something.
Central Park as a Weather Station Site
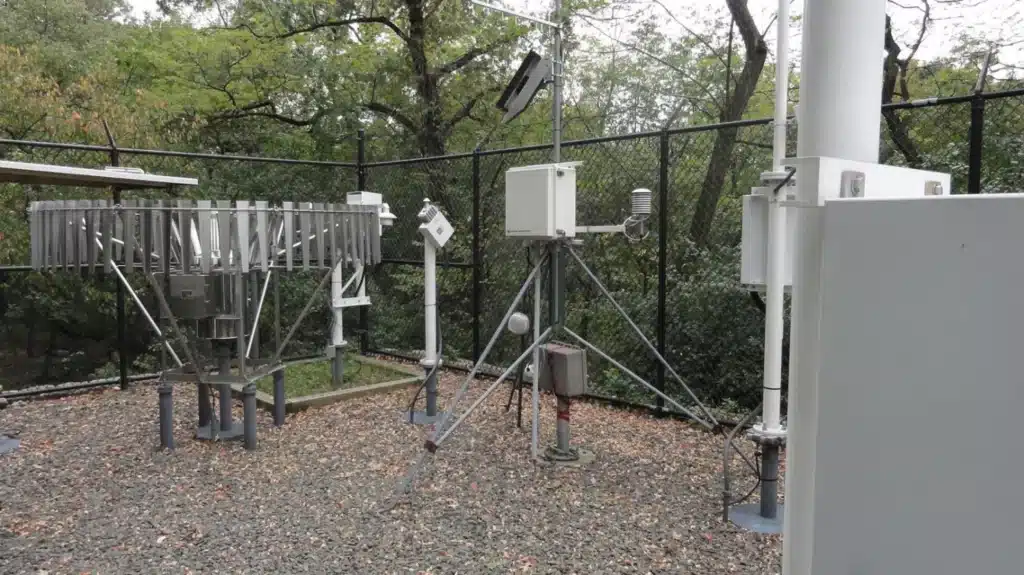
If you’ve never thought about Central Park as a weather observation site, here’s the picture. The station sits on a grassy area surrounded by trees, at about 154 feet elevation, in the middle of Manhattan. On days with light southerly wind, the urban heat island effect from the surrounding city pushes the reading higher than what the models predict for that grid cell. On days with a strong cold front from the northwest, the park’s open northern exposure means it cools off faster than the surrounding built-up areas.
If you run a station within a few miles of Central Park and you’ve been watching this relationship, you already know which way the bias goes under different wind regimes. An Ambient Weather WS-5000 with its ultrasonic anemometer captures wind shifts in real time, which is useful for identifying those transition days when the bias flips. And if your data feeds into the Ambient Weather Network, you’ve got a searchable archive to build that comparison dataset. Our wind chill calculator can also help illustrate how much wind alone changes the effective conditions, though keep in mind that Kalshi markets settle on actual air temperature, not wind chill.
That station-level knowledge is something no trading bot or GFS ensemble can replicate. You have to live with the data.
The Daylight Saving Time Trap
This one is confirmed directly by Kalshi’s own help documentation, and it trips people up.
NWS Climate Reports use local standard time for recording daily highs, not clock time. During Daylight Saving Time, the “daily high” observation window runs from 1:00 AM to 12:59 AM local time the following day. Not midnight to midnight.
What does that mean in practice? Say it’s a warm spring night and the temperature hits 72°F at 1:15 AM EDT. In standard time, that’s 12:15 AM EST. If the temperature drops from there for the rest of the day and only reaches 68°F during the afternoon, the official high is 72. The daily maximum was locked in at a time most people were asleep.
If you run a home station with a data logger, you see the full 24-hour temperature curve in minute-by-minute resolution. You’d catch that overnight spike and know the high was already set before the market even opened for active trading the next morning. Most traders relying on phone weather apps or forecast data would have no idea.
This isn’t an edge you can use every day. But on spring and fall transition days, or on nights when a warm front passes through, it’s the kind of thing that separates someone who watches the data from someone who checks an app.
My Thoughts on Prediction Markets
Prediction markets are a polarizing topic. Some people see them as a powerful information aggregation tool. Others see them as gambling with extra steps. States like Nevada have challenged Kalshi in court. Tennessee is working on regulation. These are policy conversations worth having, and I’m not here to take a side on them. This article is about whether weather knowledge translates to better forecasting than the crowd. I think it does.
A February 2026 Federal Reserve working paper evaluated Kalshi’s accuracy for economic forecasting and found that the platform’s predictions carried a 40.1% lower error rate than professional consensus forecasts over a two-year period. That’s impressive for economics. But weather is different. Weather model data is free and public. The NWS uses the same GFS and ECMWF data you and I can pull up. And weather station owners have something the models don’t: ground truth from a specific location that captures microclimate effects the models can’t resolve at their 28-kilometer grid spacing.
The weather prediction market space is also still thin. According to iGaming Business, a single NCAA tournament game recently attracted $24 million in Kalshi trades. Weather markets see a fraction of that. Thin markets mean less efficient pricing, which is exactly where local expertise should have the biggest advantage.
Citizens Bank estimates the overall prediction market industry is running at $3 billion in annual revenue with a path to $10 billion by 2030. If the weather category grows with the rest of the industry, the opportunity only gets bigger.
What I’d Do Differently Next Time
If I run this experiment again with real money, here’s what I’d change.
I’d track more cities. NYC was a good starting point, but the real edge might be in cities where the NWS forecast accuracy is worse. The mountain west and the Great Plains have day-one errors averaging 4 to 6 degrees in some locations. If Kalshi runs markets for Denver or similar cities, that’s where the model-versus-observation gap is widest.
I’d invest in better mounting. If you’re serious about using your station data for something beyond hobby observation, your mounting setup matters more than usual. You need consistent siting and a clean comparison to the official station. Before buying a station for this purpose, I’d also recommend running our Signal Range Predictor to make sure the sensor can reliably reach your console from the spot you plan to mount it.
I’d build a longer historical dataset. Two months of comparison data between my station and the NWS site is a starting point. Six months to a year would give much higher confidence in the bias patterns by wind direction and season. And I’d keep the station well-maintained to avoid sensor drift corrupting the dataset.
Conclusion
My two weeks of paper trading suggest that weather station owners who understand their local microclimate have a real information advantage over Kalshi’s temperature markets. The experiment was short and the data was idealized, so take the specific numbers with skepticism. But the underlying logic holds up: the market is priced by generalists, and the settlement is determined by a weather station. If you know weather stations better than the average trader, the odds tilt in your favor.
Your $200 Ambient Weather station and a spreadsheet might be more useful than you think. At the very least, you’ll learn something interesting about the gap between what the models say and what actually happens at your nearest NWS site. And in this hobby, that kind of knowledge is its own reward, whether you ever place a trade or not.
More from Weather Station Advisor:
- How to Improve the Accuracy of Your Home Weather Station
- Weather Station Mounting Ideas and Solutions
- What is a Weather Station?
- Home Weather Station Maintenance and Cleaning
Data sources: Keyrock/Dune Analytics, Kalshi Help Center, Federal Reserve FEDS Paper 2026-010, Fortune, Citizens Bank/CoinDesk, Chris Dodds, Washington Post, NSSL, NWS CWOP, Open-Meteo, GitHub.